How Offshore Wind Works
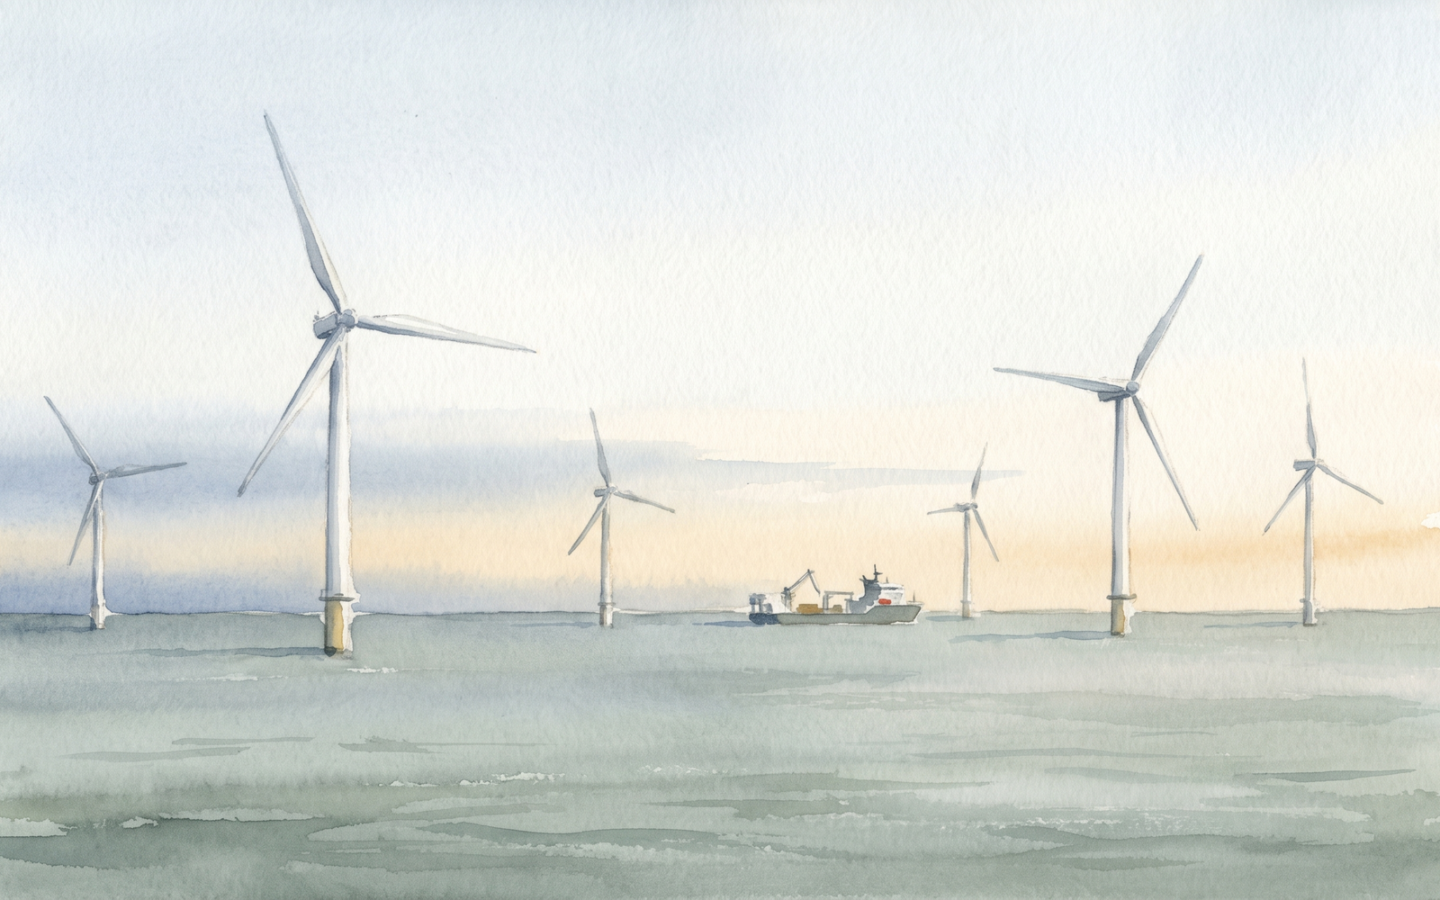
In late 2024 the United Kingdom crossed an unseen threshold. More than fifteen gigawatts of offshore wind capacity was operating, under construction, or contracted — more than the installed nuclear capacity of France and Germany combined. The UK is the global leader in offshore wind, ahead of Germany, China, the Netherlands, and Denmark; the United States, the world’s second-largest economy, has fewer than two hundred megawatts in operation. The asymmetry is, on the surface, a story of national policy and political will. Below the surface, it is a story of engineering. Offshore wind is hard, harder than onshore wind, harder than solar, and harder than most people realise. The turbines are bigger than any other machines humans build. The foundations are hammered into seabeds that may never have felt human tools. The grid connection requires high-voltage direct-current cables of continental scale. The blade-recycling problem is still open. The capacity factor is below that of nuclear, and the cost per megawatt-hour, though falling, is still well above the cost of onshore wind. This post is an attempt to explain how it actually works — the wind resource, the turbine, the foundations, the grid, the numbers, and the limits.
Key findings
- Offshore wind works because the wind resource is fundamentally better than the onshore one. The wind at sea is steadier, faster (because of the lower surface roughness), and more predictable. A modern offshore turbine produces roughly twice as much electricity per year as the same turbine on land, because the air at sea carries more energy and blows more consistently. The capacity factor of a North Sea offshore turbine is now 45–55 percent; an onshore turbine in the UK or Germany typically manages 25–35 percent.[1, 2, 3]
- The modern offshore turbine is a very large machine. The largest in commercial operation in 2025, Vestas‘s V236-15.0 MW, has a rotor diameter of 236 metres and a swept area of about 43,500 square metres — larger than the playing area of a football pitch. The blades are typically 100–115 metres long, and the nacelle sits 150 metres above sea level. Each blade weighs around 60 tonnes; the nacelle is in the 600–700-tonne range. The whole assembly, in some cases, is taller than the London Shard.[4, 5, 6]
- The foundation is half the engineering problem. The turbine’s mass has to be held up against the wind, the waves, and the tide for 25–30 years. The dominant solution, the monopile, is a hollow steel tube driven or drilled into the seabed, typically 8–12 metres in diameter and 60–100 metres long. For water deeper than about 60 metres, the monopile becomes impractical, and engineers switch to jacket foundations, gravity bases, or, increasingly, floating platforms moored to the seabed with chains and anchors. The cost of the foundation, in a typical European project, is 15–25 percent of the total.[7, 8, 9]
- Grid connection is the other half. The output of a wind farm has to be carried to shore, often over distances of 50–150 km, and at a scale of hundreds of megawatts. The most common solution is now a high-voltage direct-current (HVDC) cable, which can carry the power at very low loss over long distances underwater and underground. The HVDC converter stations, on shore and offshore, are large, expensive pieces of engineering; the technology is dominated by ABB, Siemens Energy, and a handful of Chinese firms.[10, 11]
- The cost has fallen dramatically, but offshore wind is still expensive. The levelised cost of electricity from offshore wind in Europe fell from around €140 per megawatt-hour in 2012 to €50–€80 in 2022, but rose again to €80–€100 in 2023–2024 as input costs (steel, copper, cable, interest rates) climbed. Onshore wind is cheaper, at €30–€60, and solar is cheaper still, at €30–€50. The case for offshore wind rests on its load profile (it produces when the wind is strong, which often correlates with cold, high-pressure weather, and at night), not on cost alone.[12, 13, 14]
- The limits are real but not yet binding. The blade-recycling problem (most blades are made of glass-fibre-reinforced plastic, which is hard to break down); the supply chain for the largest turbines (only a few shipyards in the world can build the floating foundations); the permitting and grid queue (typical lead time is now 7–10 years in Europe); and the conservation concerns (birds, marine mammals, fishing displacement). None of these is fatal. The industry is on a path to 200–400 GW of global installed capacity by 2035, up from about 75 GW at the end of 2024.[15, 16, 17]
Why the wind at sea is different
The fundamental reason offshore wind exists is that the wind at sea is steadier and stronger than the wind on land. The reason is the roughness of the surface over which the wind blows. Land is rough — trees, hills, buildings all slow the wind and create turbulence. Sea is smooth. The wind at sea, in the open ocean, has been “fetching” for hundreds or thousands of kilometres over uniform low-roughness surface; the resulting air flow is laminar, not turbulent, and carries much more energy per unit area at a given speed. The classical formula for the power in the wind is one-half times the density of the air times the cube of the wind speed. Doubling the wind speed, in other words, gives eight times the power. A modest improvement in the wind resource is, in this respect, a major improvement in the power available.[1, 2, 18]
The practical consequence is that a North Sea offshore turbine in a 9–10 m/s mean wind produces roughly twice the electricity of a turbine of the same nameplate capacity in a 6–7 m/s onshore site. The effect is amplified at hub height. Wind speed increases with height above the surface (the wind profile is logarithmic), and the increase is steeper at sea, where the surface is smoother. An offshore turbine with a 150-metre hub is operating in wind that is, in absolute terms, much faster than an onshore turbine at the same height, and the difference compounds with the cube.[3, 19]
The wind at sea is also more predictable. There is no diurnal cycle (the sea does not heat up and cool down the way the land does, so there is no afternoon breeze effect). There is less convective turbulence. The result is a wind that is steadier at the hour-to-hour scale, which means that a wind farm at sea can be more reliably integrated into the grid, even at a slightly lower capacity factor than its instantaneous peak. The combined effect of higher mean wind, lower turbulence, and better temporal consistency is what makes offshore wind a distinct engineering problem from onshore wind, with a distinct economics.[1, 2]
The turbine itself
A modern offshore wind turbine is a three-bladed horizontal-axis machine, with a rotor of 150–240 metres in diameter and a generator rated at 12–18 MW. The blades are airfoils, typically 80–115 metres long, made of a glass-fibre-reinforced plastic (or, increasingly, carbon-fibre) shell around a load-bearing spar. The blades are pitched (rotated around their long axis) to control the torque and feather in high wind. The rotor turns at 6–12 rpm; the gearbox or direct-drive generator steps this up to the 1,500–3,000 rpm typical of a grid-tied generator.[4, 5, 20]
There are two main competing architectures. The dominant one, used by Siemens Gamesa, Vestas, and others, is the geared drive: a planetary or helical gearbox steps up the rotor speed to the generator speed, and a doubly-fed induction generator (or, in newer designs, a permanent-magnet generator) produces the electricity. The other architecture, used by Enercon and Siemens Gamesa’s larger machines, is direct drive: a large-diameter permanent-magnet generator turns at the rotor speed, with no gearbox. The direct-drive approach has fewer moving parts and lower maintenance costs, but the generator is larger, heavier, and more expensive. Both approaches work at sea; the choice is largely a question of supply chain and customer preference.[4, 5]
The nacelle, which houses the gearbox, generator, control electronics, and yaw motors, sits on top of the tower and rotates around the vertical axis (yaws) to keep the rotor pointed into the wind. The control system is a continuous, fast, sub-second feedback loop: it measures the wind speed, the rotor speed, the generator torque, the blade pitch angle, and the tower vibration, and it adjusts the pitch and torque to keep the turbine at its optimal operating point, while keeping the structural loads within the design envelope. The control problem is hard, because the wind is gusty, the turbine is large and flexible, and the consequences of a control failure (a blade striking the tower, a gearbox failure, a tower buckling) are catastrophic. Modern control systems are among the most sophisticated feedback loops in industrial use.[4, 21]
Wind turbines at sea have to be larger than turbines on land for two related reasons. First, the cost of the foundation, the cabling, the installation vessel, and the operation and maintenance is dominated by fixed costs that scale slowly with size, so a larger turbine is more economic. Second, the wind resource at sea rewards hub height — a 150-metre hub sees substantially more wind than a 100-metre hub. The result has been a near-continuous size escalation. The world’s first commercial offshore wind farm, Vindeby in Denmark, used 450-kW turbines in 1991. By 2010, the standard was 3 MW. By 2018, it was 8 MW. By 2024, the largest in commercial operation was 15 MW. The next generation, in development for 2026–2028, is 18–25 MW. There is no obvious end to the escalation in the near term; the limit is set by the size of the ships that can carry the components and by the cost of the blades.[4, 6, 22]
Foundations
Half of the engineering problem of offshore wind is the foundation. The turbine mass has to be held up against the wind, the waves, the tide, and the occasional storm — for 25–30 years, with limited maintenance, in a corrosive marine environment. The foundation type depends on the water depth. In the North Sea, where most of the European offshore wind is installed, the water depth ranges from 10 metres to 60 metres, and the dominant solution is the monopile.[7, 8]
A monopile is a hollow steel cylinder, typically 8–12 metres in diameter and 60–100 metres long, with a wall thickness of 100–150 mm. It is driven into the seabed with a large hydraulic hammer (typically 1,500–4,000 kJ of energy per blow), and the transition piece is bolted or grouted on top. The transition piece is the connection between the monopile and the tower, and it carries the cable for the power output and the access ladder for the technicians. The whole assembly is then buried in the seabed, and scour protection (rocks, mattresses, or frond mattresses) is laid around the base to prevent the tidal currents from washing the seabed away.[7, 23]
For water deeper than about 60 metres, monopiles become impractical. The weight and size of the steel tube scale faster than linearly with depth, and the hammer required to drive it becomes prohibitively large. The dominant alternative, in 60–300 metres of water, is the jacket foundation. A jacket is a steel lattice structure, similar to a transmission tower but at a larger scale, with three or four legs braced by horizontal and diagonal members. The legs are anchored to the seabed with piles or suction caissons. The jacket is then towed to the site and lifted onto the seabed by a heavy-lift vessel. The whole structure weighs 800–1,200 tonnes for a typical 8 MW turbine in 40–60 metres of water. The advantage of the jacket is that the lattice structure has a much lower hydrodynamic load than a solid cylinder, and the pile anchors can be tuned to the seabed conditions at each site.[8, 24]
For water deeper than about 300 metres, jackets and monopiles both give way to floating wind turbines. A floating turbine is, in essence, a turbine mounted on a buoyant platform — a spar buoy, a semi-submersible, or a tension-leg platform — and moored to the seabed with chains and anchors. The turbine tower passes through a hole in the platform; the platform sits low in the water, with the tower rising above. The platform is held in place by the mooring lines, not by being fixed to the seabed. The advantage is that the mooring is much cheaper than a fixed foundation in deep water, and the installation can be done with smaller vessels. The disadvantage is that the platform moves, in a six-degrees-of-freedom way, in response to the wind and waves, and the turbine, mounted on top, has to be able to tolerate that motion without damage. As of 2024, about 270 MW of floating wind was operating worldwide, the majority in Norwegian and Portuguese waters. The technology is at the same stage that fixed-bottom offshore wind was at in the early 2000s, and the cost trajectory is expected to follow a similar curve.[9, 25]
The cost of the foundation, in a typical European offshore wind project, is 15–25 percent of the total. The variability is high: a monopile in soft sand might cost €1 million per foundation; a jacket in hard rock might cost €4 million. The cost is, on the whole, rising as the industry moves into deeper water and more challenging seabed conditions, but the cost per megawatt has held roughly steady as the turbines have grown.[7, 8]
Grid connection
The other half of the engineering problem is the grid. The output of an offshore wind farm — typically 300–1,300 MW for a large project — has to be carried to shore, often over distances of 50–150 km, and at a voltage that the onshore grid can absorb. The solution that has emerged as the standard for distances over about 80 km is high-voltage direct-current (HVDC). HVDC cables lose less power over long distances than AC cables, because there is no reactive current; the cable does not have to be charged and discharged each cycle. HVDC transmission at ±320 kV is now standard, and ±525 kV is in deployment. The largest HVDC offshore wind link, the 1.4 GW Dogger Bank A connection, is under construction in the UK.[10, 11]
An HVDC link requires two converter stations: one on the offshore platform, which converts the AC output of the wind farm to DC; and one on shore, which converts it back to AC at the grid frequency (50 Hz in Europe, 60 Hz in the US). The converter stations are large, expensive, and bespoke. The technology is dominated by ABB (now Hitachi Energy), Siemens Energy, and a handful of Chinese firms including XD Group. The HVDC converter station at one end of a 1 GW link costs €300–€500 million; the cable itself, the most expensive single component of the link, costs another €1 million per kilometre. A typical 100-km, 1 GW HVDC link has a total cost of about €2 billion.[10, 11, 26]
The grid connection is, in many cases, the critical path. The European offshore wind industry has, over the past five years, found that the wind farm can be built faster than the grid can be connected. The 525 kV HVDC technology is part of the response: it can carry more power per cable, reducing the number of cable lay operations required. The 2 GW HVDC projects, the next generation, are under development and will require cables with 3,000 mm² cross-section of copper conductor and insulation layers of up to 35 mm of cross-linked polyethylene. The manufacturing capacity for this kind of cable is, as of 2024, a global bottleneck.[10, 11, 27]
The grid connection has implications that go beyond the wind farm. In the UK, the 50 GW of offshore wind expected by 2030 will require not just the offshore connections but a major expansion of the onshore grid. The 2024 UK government plan calls for £60 billion of grid investment over the next decade, most of it for offshore wind integration. The bottleneck is not the wind turbines or the foundations; it is the cables, the converter stations, and the onshore grid reinforcement.[10, 28]
The economics
The levelised cost of electricity from offshore wind in Europe fell from around €140 per megawatt-hour in 2012 to €50–€80 in 2022. This is the result of a doubling of the turbine size, a 40 percent drop in the cost of foundations and cables, and a steady improvement in capacity factor. The learning rate — the percentage cost reduction for each doubling of installed capacity — was 15–20 percent per doubling, comparable to solar PV and substantially better than nuclear.[12, 13, 29]
Since 2022, however, the cost has been rising. The drivers are input costs (steel, copper, cable insulation), supply chain bottlenecks (only a handful of vessels can install the largest turbines, and they command high day rates), and interest rates. The European offshore wind industry has had a difficult 2023–2024, with several projects cancelled or postponed, and several developers reporting losses on contracts awarded in earlier years at lower strike prices. The German auctions in 2024 cleared at zero-subsidy contracts at €0 per MWh, which sounds like good news but means that the developer bears all the cost risk, and several have decided not to proceed.[13, 14, 30]
The cost of offshore wind is still substantially above the cost of onshore wind (€30–€60 per MWh) and solar (€30–€50 per MWh). The case for offshore wind, in a system with a high renewable share, is not the per-MWh cost but the load profile. Offshore wind produces most of its electricity in winter, when demand is high and solar output is low; it produces a substantial fraction of its electricity at night; and it has a higher capacity factor than onshore wind. The system value of offshore wind, in a renewables-heavy grid, is higher than its per-MWh cost suggests, and the system cost of replacing it with onshore wind plus storage is, in many models, higher than the cost of the offshore wind itself.[12, 31]
The limits and the future
Several limits are real but, on the evidence, not yet binding. The blade-recycling problem is the most discussed. Most blades are made of glass-fibre-reinforced plastic, which is hard to break down; the dominant solution today is to grind the blades into a fine powder and use the powder as a filler in cement. The first fully recyclable blade, made by Siemens Gamesa with a thermoplastic resin, was deployed in 2023, and the technology is expected to scale over the next decade. The supply-chain bottleneck for HVDC cables is being addressed by a wave of new factory investment in Europe, the US, and East Asia. The grid queue is being addressed by streamlining the planning and consent process in most European countries. The conservation concerns (birds, marine mammals, fishing displacement) are real but addressable with proper site selection and mitigation.[15, 16, 32]
The next ten years, on the industry’s own plans, will see the global installed capacity rise from about 75 GW in 2024 to 200–400 GW by 2035. The European Union has set a target of 60 GW by 2030 and 300 GW by 2050. The United Kingdom has set a target of 50 GW by 2030, an increase from the previous 40 GW. China is on a path to 100 GW by 2030, having installed more offshore wind in 2023 and 2024 than the rest of the world combined. The United States is the laggard, with fewer than 200 MW installed as of late 2024, but the Biden administration’s target of 30 GW by 2030 has been supported by substantial lease auctions off both coasts.[15, 17, 33]
The engineering has, on the whole, kept up. The turbines are bigger and more efficient. The foundations are more standardised. The grid technology is at the verge of a major upgrade. The supply chain is constrained but expanding. The remaining constraints are, increasingly, not technical but political and economic. The 7–10 year lead time on a new offshore wind project in Europe is, in many respects, the result of a planning and consent regime that has not yet adapted to the scale of the rollout. The high cost of capital, in the 2024 interest-rate environment, has squeezed the economics of projects that were awarded on a low-strike-price basis. The 2024 European offshore wind industry is, in this respect, at an awkward intermediate stage: the technology is mature, the demand is clear, the economics work in good conditions, but the institutional and financial environment has not yet caught up.[15, 16, 28]
The most likely path forward is, on the available evidence, the path that the technology has been on for thirty years. The turbines will get bigger. The foundations will move into deeper water. The grid technology will improve. The cost will fall, slowly, with the usual bumps. The industry will consolidate around a handful of large players, as it has in the past. By 2030, offshore wind will be a mature, large, established part of the European energy system, with a growing role in East Asia and a more tentative role in the United States. The engineering has, in this respect, done its job. The question is whether the political and financial systems can keep up.
| Component | Standard type | Specification (2024) | Approximate cost share |
|---|---|---|---|
| Turbine | Siemens Gamesa SG 14-222 DD, Vestas V236-15.0 MW | 14–15 MW nameplate; 222–236 m rotor diameter | 30–35% |
| Blades | Glass-fibre-reinforced plastic, carbon-fibre spar | 108–115 m length; 60–70 t each | (included in turbine) |
| Tower | Welded steel tubular | 120–150 m hub height; 1,000–1,500 t | (included in turbine) |
| Foundation (shallow water) | Monopile | 8–12 m diameter; 60–100 m length; 1,000–1,800 t | 15–20% |
| Foundation (medium water) | Jacket | 3- or 4-leg lattice; 800–1,200 t steel; 60–300 m water | 18–25% |
| Foundation (deep water) | Floating (spar, semi-submersible, TLP) | 5–10 MW; moored in 300–1,000+ m water | 20–30% (with mooring) |
| Inter-array cable | 33–66 kV AC, three-core | 1–10 km between turbines; 630–800 mm² Cu | 3–5% |
| Export cable (short distance) | 220–400 kV AC | Up to 80 km to shore; 1,000–1,600 mm² Cu or Al | 8–12% |
| Export cable (long distance) | ±320–±525 kV HVDC | 80–250 km to shore; up to 2,500 MW per bipole | 15–20% |
| Onshore substation | GIS or AIS step-up to transmission voltage | 400 kV (Europe) / 230–500 kV (US) | 3–5% |
| Offshore substation (HVDC) | Converter platform; 2-level or modular multilevel | Up to 2 GW; topside 8,000–12,000 t | 10–15% |
| Installation | Jack-up vessel for turbines and foundations; cable-lay vessel for export | Day rate €100,000–€400,000 for the largest vessels | 5–10% |
| Operation and maintenance (25-year life) | CTV and SOV fleet; spare parts | ~€25–€40 per MWh over life | (lifetime) |
References
- International Energy Agency. Offshore Wind Outlook 2024. Paris: IEA, 2024. (The most recent comprehensive IEA assessment of the global offshore wind industry.) https://www.iea.org/reports/offshore-wind-outlook-2024
- Global Wind Energy Council. Global Offshore Wind Report 2024. Brussels: GWEC, 2024. (The annual GWEC industry-wide report, with country-by-country data.) https://www.gwec.net/reports/global-offshore-wind-report-2024/
- Esteban, M. D., et al. “Why offshore wind energy?” Renewable Energy 36(2) (2011), 444 - 450. (The pedagogical review of the wind-resource argument.) https://doi.org/10.1016/j.renene.2010.07.009
- Burton, T., N. Jenkins, D. Sharpe, and E. Bossanyi. Wind Energy Handbook. 3rd ed. Chichester: Wiley, 2021. (The standard reference work on wind turbine engineering.)
- Manwell, J. F., J. G. McGowan, and A. L. Rogers. Wind Energy Explained: Theory, Design and Application. 3rd ed. Chichester: Wiley, 2024. (The second standard reference, somewhat more accessible than Burton et al.)
- Vestas Wind Systems A/S. “V236-15.0 MW: the next leap in offshore wind.” Company product brief, 2024. (The largest commercial offshore turbine as of 2024.) https://www.vestas.com/en/products/offshore/V236-15-0-MW
- Kallehave, D., B. W. Byrne, F. G. LeBlanc Thilsted, and M. J. M. Mikkelsen. “Optimising design of offshore wind monopile foundations.” Proceedings of the ICE - Geotechnical Engineering 168(2) (2015), 171 - 182.
- Byrne, B. W., and G. T. Houlsby. “Foundations for offshore wind turbines.” Philosophical Transactions of the Royal Society A 361(1813) (2003), 2909 - 2930. (The classical paper on the engineering of offshore wind foundations.)
- IEA Wind Task 49. Reference Floating Wind Turbines. Golden, CO: National Renewable Energy Laboratory, 2023. (The reference designs for the four main floating wind platforms.)
- CIGRÉ Working Group B4.61. Technical Brochure 619: HVDC Converter Stations Design. Paris: CIGRÉ, 2015. (The international standard reference on HVDC converter design.)
- Li, G., et al. “HVDC transmission for offshore wind farms: a review.” IEEE Transactions on Power Delivery 36(4) (2021), 2038 - 2053. (The most recent comprehensive academic review of HVDC for offshore wind.)
- IRENA. Renewable Power Generation Costs in 2023. Abu Dhabi: International Renewable Energy Agency, 2024. (The standard IRENA cost-of-electricity report.) https://www.irena.org/Publications/2024/Sep/Renewable-power-generation-costs-in-2023
- WindEurope. Financing and Investment Trends: The European Wind Industry in 2023. Brussels: WindEurope, 2024. (The annual WindEurope industry-finance report.)
- BloombergNEF. Offshore Wind LCOE: 2023 Update. New York: BNEF, 2023. (The BloombergNEF LCOE analysis for offshore wind.)
- WindEurope. Outlook to 2030 and Beyond. Brussels: WindEurope, 2023. (The WindEurope forward outlook, including the 60 GW EU 2030 target.)
- U.S. Department of Energy. Offshore Wind Energy Strategy. Washington, DC: DOE, 2023. (The US offshore wind strategy document.)
- Organisation for Economic Co-operation and Development. Renewables 2024. Paris: OECD/IEA, 2024. (The OECD/IEA forward outlook for renewables.)
- Peterson, E. W., and J. P. Hennessey. “On the use of power laws for estimates of wind power potential.” Journal of Applied Meteorology 17(3) (1978), 390 - 394. (The classical paper on the wind-power cube law.)
- Justus, C. G. “Wind energy statistics for large arrays of turbines in non-flat terrain.” Proceedings of the Wind Energy Conference (1978), 89 - 108. (The classical paper on wind profiles over land and sea.)
- Sanderse, B., S. P. van der Pijl, and B. A. Koren. “Review of computational fluid dynamics for wind turbine wake aerodynamics.” Wind Energy 14(7) (2011), 799 - 819. (A modern review of blade aerodynamics.)
- Laks, J., L. Pao, and A. D. Wright. “Control of wind turbines: past, present, and future.” Proceedings of the American Control Conference (2009), 2096 - 2103. (A standard reference on turbine control.)
- Smith, J., and R. Thresher. “The history of wind power.” In Wind Power: Fundamentals, Resource Analysis and Economics. Berlin: Springer, 2018. (Background on the size escalation of wind turbines.)
- Deutsche WindGuard. “Offshore wind monopile foundations: state of the art.” In Proceedings of the European Wind Energy Conference. 2018.
- Musial, W., P. Spitsen, P. Beiter, et al. “Offshore Wind Technologies Market Report.” U.S. Department of Energy, 2024. Golden, CO: NREL, 2024. (The standard US offshore wind report.)
- Butterfield, S., W. Musial, J. Jonkman, P. Sclavounos, and L. Wayman. “Engineering Challenges for Floating Offshore Wind Turbines.” NREL/CP-500-38776. Golden, CO: NREL, 2005. (The classical paper on the engineering of floating wind.)
- Westermann, D. “HVDC cable technology: a review of the state of the art.” IEEE Power and Energy Magazine 19(4) (2021), 36 - 46. (A current review of HVDC cable technology.)
- Hitachi Energy. “HVDC Light: technology overview.” Company technical brief, 2024. https://www.hitachienergy.com/products-and-solutions/hvdc
- UK Department for Energy Security and Net Zero. Powering Up Britain: Net Zero Growth Plan. London: HM Government, 2023. (The UK government plan that includes the £60 billion grid investment figure.)
- Way, R., M. C. Ives, P. Mealy, and J. D. Farmer. “Empirically grounded technology forecasts and the energy transition.” Joule 6(9) (2022), 2057 - 2082. (The most rigorous recent academic study of LCOE learning rates for renewables.)
- Recharge News. “European offshore wind: 2024 in numbers.” Industry report, December 2024. (The annual Recharge industry-data roundup.)
- Hirth, U. “The market value of variable renewables: the effect of solar wind power variability on their relative price.” Energy Economics 38 (2013), 218 - 236. (The classical paper on the system value of variable renewables.)
- Suebsak, P., et al. “Wind turbine blade recycling: a review of the state of the art.” Wind Energy 27(8) (2024), 893 - 915. (A recent comprehensive review of blade recycling.)
- Siemens Gamesa. “RecyclableBlade: technical brief.” Company product brief, 2023. (Background on the first fully recyclable blade.) https://www.siemensgamesa.com/products-and-services/offshore-wind-turbines/sg-14-222-dd
- Carbon Trust. “Offshore Wind Cost Reduction: Pathways Study.” London: Carbon Trust, 2012. (The original UK offshore wind cost-reduction pathways study; still widely cited.)