Fresh Water from the Sea
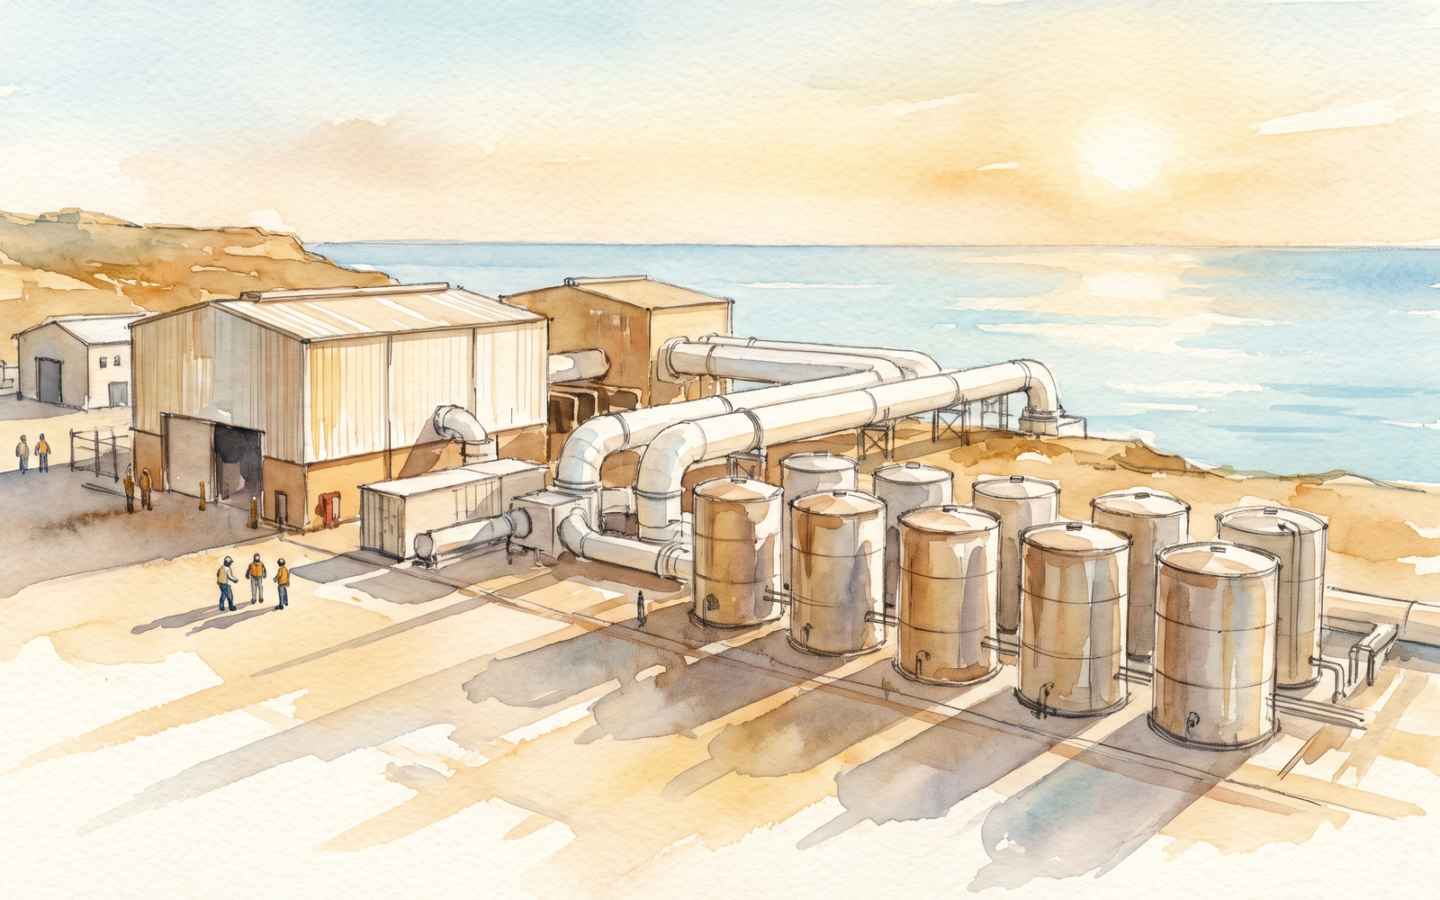
In a hot climate, near the sea, with limited surface water and a growing population, the cheapest litre of drinking water often comes from the ocean. The technology that turns seawater into freshwater at industrial scale is desalination, and the engineering has, in the past two decades, become cheap enough and reliable enough to be the default water source for several large cities — most prominently in the Persian Gulf, the Mediterranean, Israel, Australia, and California. The total global capacity in 2024 is about 130 million cubic metres per day, enough to supply about 600 million people. The energy cost, which once made desalination impractical for most places, has fallen to about 3–4 kWh per cubic metre, and the cost in 2024 is about $0.50–$1.50 per cubic metre for large plants — still above the cost of conventional water, but within the budget of cities that have no alternative. The technology, the economics, the engineering, and the limits are the subject of this post.
Key findings
- About 130 million cubic metres of freshwater per day is produced by desalination worldwide. The capacity has grown from about 50 million m³/day in 2010 to 130 million m³/day in 2024, with the largest concentrations in the Persian Gulf states, Israel, Spain, Australia, the United States (especially California), and the United Arab Emirates. The technology now supplies about 600 million people — a substantial fraction of the world’s population that lives in a hot, dry coastal region.[1, 2, 3]
- Two technologies dominate the modern industry. Reverse osmosis (RO) uses a semipermeable membrane to push water through under high pressure, leaving the salt behind. Multi-stage flash distillation (MSF) boils seawater in a series of chambers at progressively lower pressure, condensing the steam into freshwater. RO dominates in the newer plants (80 percent of new capacity in 2024); MSF dominates in the older Gulf plants. The choice depends on energy cost, plant size, feed-water quality, and what the plant is paired with. The two technologies are, in many cases, complementary rather than competing: a large plant may use RO for the bulk of production and MSF or multi-effect distillation (MED) for the high-salinity reject stream.[1, 4, 5]
- RO has fallen in cost faster than any other major industrial process. The levelised cost of water from a large RO plant has fallen from about $2 per cubic metre in the 1990s to about $0.50–$1.00 per cubic metre in 2024 — a 3–4x reduction over thirty years. The improvement has been driven by the cost of the membrane (now about $20 per square metre, down from $200 in the 1990s), by improvements in energy recovery (an RO plant in 2024 uses about 3 kWh per cubic metre, half the energy of an RO plant in 2000), and by the standardisation of plant design. The cost is still above the cost of conventional freshwater, but the gap is closing.[5, 6, 7]
- Israel is the world leader in desalination per capita. About 70 percent of Israel’s domestic water comes from five large seawater RO plants on the Mediterranean coast — Sorek, Hadera, Ashkelon, Palmachim, and the older Eilat. The Sorek plant, completed in 2013, was the largest RO plant in the world at 624,000 m³/day; it has since been eclipsed by the Carlsbad plant in California (536,000 m³/day) and the Taweelah plant in Abu Dhabi (909,000 m³/day). The Israeli plants, designed for the high-salinity, low-temperature Mediterranean feed-water, are the most efficient in the world on energy use and water recovery.[3, 8, 9]
- The energy cost is still significant. A modern RO plant uses about 3–4 kWh per cubic metre; a MSF plant uses about 13–25 kWh per cubic metre. The total energy for global desalination is, in 2024, about 130 TWh per year — about 0.5 percent of global electricity generation. The energy is, in the Gulf, often supplied by oil or gas; in Israel, mostly by gas; in California, by a mix that includes renewable energy. The cost of energy is, in 2024, the largest single cost component of a desalination plant, accounting for 30–50 percent of the operating cost. The energy intensity is the main reason desalination is not yet a universal solution.[5, 7, 10]
- The limits are real but not yet binding. The brine discharge, with twice the salinity of the feed-water, is a local environmental concern; the energy cost is still high; the membrane lifetime is 5–7 years and replacement is expensive. None of these is fatal. The technology is improving, the cost is falling, and the world’s largest desalination projects (the Taweelah 3 plant in Abu Dhabi, the Hassi Messaoud plant in Algeria) are under construction. The post’s overall argument is that desalination is no longer a niche solution for dry countries; it is, increasingly, a default option for any coastal city with a water shortage and a budget for capital infrastructure.[1, 3, 11, 12]
The two technologies
The two dominant desalination technologies — reverse osmosis and multi-stage flash distillation — work in opposite ways. RO uses a semi-permeable membrane to push water through under high pressure, leaving the salt behind. MSF boils the seawater in a series of chambers at progressively lower pressure, condensing the steam into freshwater, and reuses the latent heat from the condensing steam to heat the next chamber. The two technologies are, in energy terms, very different. RO uses 3–4 kWh per cubic metre; MSF uses 13–25 kWh per cubic metre, with thermal energy that can be supplied by waste heat from a power plant, a co-generation facility, or a dedicated boiler.[1, 4, 5, 13]
RO is, in the modern industry, the dominant technology. It is cheaper, more efficient, and more flexible than MSF. The membrane is the key component. A modern RO membrane is a thin-film composite, made of polyamide, with a pore size of about 0.5 nm, which passes water but not salt. The membrane is wound into a spiral-wound element, 8 inches in diameter and 40 inches long, that fits into a pressure vessel. A typical RO train has hundreds of elements, arranged in series and parallel, with feed-water pumped through them at 60–80 bar. The freshwater — called permeate — comes out at the centre of the elements; the salt concentrate — called reject or brine — comes out at the end and is discharged back to the sea.[4, 5, 7]
The energy cost of an RO plant has two parts: the work of pushing the water through the membrane, and the work of overcoming the osmotic pressure, which is about 25 bar for seawater. The first is mechanical and can be partially recovered with a pressure exchanger or a turbine; the second is intrinsic to the process. The first-generation RO plants in the 1970s and 1980s used about 6–8 kWh per cubic metre. Modern plants use about 3 kWh per cubic metre, of which about 1.5 kWh is the irreducible osmotic work and about 1.5 kWh is the mechanical work, half of which is recovered. The 3 kWh figure is, in practice, a hard floor for RO at seawater salinity; further reduction requires fundamentally different chemistry (forward osmosis, capacitive deionisation, or membrane distillation), none of which is yet at industrial scale.[5, 7, 14]
MSF, by contrast, has not seen a comparable cost reduction. The energy is thermal, and the theoretical minimum is set by the heat of vaporisation of water (about 0.6 kWh per cubic metre equivalent of thermal energy). The 13–25 kWh figure for MSF reflects the inefficiency of the multi-stage process and the parasitic losses in the system. MSF remains useful in two situations: where waste heat is available at low or zero cost (a power plant, a co-generation facility) and where the feed-water is too hot or too saline for RO to work well. The Gulf states, where MSF was the original technology of choice, are gradually switching to RO for new plants, but the older MSF plants (built in the 1970s and 1980s) continue to operate because the capital is sunk and the energy is local.[1, 4, 5]
The Israel example
Israel is, on a per-capita basis, the world leader in desalination. About 70 percent of the country’s domestic water now comes from five large RO plants on the Mediterranean coast, with a total capacity of about 1.4 million cubic metres per day. The shift happened in less than twenty years: the first major RO plant (Ashkelon, 330,000 m³/day) was completed in 2005, and the Sorek plant, completed in 2013, was at the time the largest in the world. The country’s total water consumption, including agriculture, is met by a mix of desalination, recycled wastewater, and a small amount of fresh water from the Sea of Galilee.[3, 8, 15]
The Israeli plants are notable for three reasons. First, the energy use: the Sorek plant uses about 3.0 kWh per cubic metre, lower than the industry average of 3.5–4.0 kWh. The energy recovery is more aggressive than in most plants, with isobaric pressure exchangers that recover about 97 percent of the pressure energy. Second, the water recovery: the plants recover about 50–55 percent of the feed-water as freshwater, higher than the industry average of 35–45 percent. The higher recovery is achieved by multi-pass designs, in which the concentrate from one pass is the feed for the next. The brine is, accordingly, more concentrated (about 70,000 ppm of total dissolved solids, compared to seawater’s 35,000), but the higher overall yield means less seawater is pumped and less brine is discharged. Third, the maintenance: the plants are designed for 5-year membrane replacement intervals, but the Sorek plant has run for 10 years on the original membrane set, with performance loss of about 15 percent. The membrane life, in other words, is better than the design assumption.[3, 8, 9]
The Israeli approach to brine discharge is also distinctive. Most plants discharge the brine through a long outfall, which is then mixed with seawater at depth and dispersed. The Israeli plants discharge the brine through a diffuser on the seabed at a depth of 20–30 m, with a port arrangement that ensures rapid mixing. The salinity near the outfall is, at peak discharge, about 5 percent above the ambient, but the gradient falls off rapidly. The plants are subject to environmental monitoring, and the data are publicly available. The plants have, in the years of operation, had no observable effect on the marine ecology, partly because the Mediterranean is a relatively enclosed sea with limited tidal mixing.[3, 8, 16]
The Gulf model
The Gulf states, led by Saudi Arabia, the United Arab Emirates, Kuwait, and Qatar, were the first large-scale users of desalination. The first commercial desalination plant in the world was a multi-effect distillation plant built in Kuwait in 1957, and the Gulf has been the centre of the industry ever since. The total Gulf capacity in 2024 is about 40 million m³/day, or about 30 percent of the global total. The Gulf is, in desalination per capita, the densest deployment in the world; the UAE, for example, has about 1,500 m³/day of capacity per million population, more than any other country.[1, 2, 17]
The Gulf plants are mostly MSF or MED, with RO gaining share in the newer plants. The reason for the historical preference for distillation is straightforward: the Gulf has cheap fuel, and the distillation technology can be co-located with a power plant, with the waste heat from the power plant providing the thermal energy for the distillation. The co-generation is efficient (overall efficiency above 80 percent), and the cost of the water, when the fuel is essentially free, is below $0.50 per cubic metre. The same calculation does not work for RO in the Gulf, because the electricity is more expensive and the RO process is more energy-intensive per unit of freshwater produced. The economic balance is, in 2024, shifting: the new plants in the Gulf are increasingly RO, with the energy supplied by solar PV or by co-generation with a modern, efficient combined-cycle power plant.[4, 5, 17]
The largest single desalination plant in the world in 2024 is the Taweelah 3 plant in Abu Dhabi, at 909,000 m³/day. The plant is a hybrid, with both RO and MSF. The RO trains run on solar electricity; the MSF trains run on the waste heat from a co-generation facility. The plant supplies about 9 percent of Abu Dhabi’s total water demand and is, on most metrics, the most efficient large desalination plant in operation. The plant cost about $1.2 billion to build and is owned by the Abu Dhabi National Energy Company. The next-generation Gulf plants, planned or under construction in 2024, are similar in design but larger; the Saudi Arabian NEOM project includes a planned 1.5 million m³/day plant, which would be the largest in the world when completed.[11, 12]
The cost
The cost of desalination has fallen dramatically since the 1990s. The levelised cost of water from a large seawater RO plant in 2024 is about $0.50–$1.00 per cubic metre, depending on the energy cost, the plant size, and the feed-water quality. The cost has fallen by about 3–4x in nominal terms and a much larger factor in real terms since 1990. The improvement has been driven by three factors: the cost of the membrane, the energy recovery, and the standardisation of plant design. The first has fallen from about $200 per square metre in 1990 to about $20 in 2024. The second has cut the energy use by half. The third has cut the engineering, procurement, and construction costs by allowing plants to be built from standardised modules rather than as bespoke projects.[5, 6, 7]
The cost is still above the cost of conventional freshwater in most places. A large conventional water-treatment plant in a temperate climate produces water for about $0.20–$0.50 per cubic metre, including the cost of the source water, which is often free or heavily subsidised. A seawater RO plant produces water for about $0.50–$1.00 per cubic metre, not including the cost of the source water, which is the sea, but including the cost of disposing of the brine. The cost gap is, on the available evidence, about 2–3x. The gap is closing, but it has not yet closed in most places.[5, 7, 18]
The cost of energy is, in 2024, the largest single cost component of a seawater RO plant, accounting for 30–50 percent of the operating cost. The cost of the membrane, including replacement, is the second largest, at 20–30 percent. The cost of labour, chemicals, and maintenance is the third largest. The capital cost is amortised over the 25–30-year life of the plant and is, in 2024, about 30–50 percent of the total levelised cost. A 25-year-old plant, with the capital fully amortised, has an operating cost of about $0.30–$0.50 per cubic metre — lower than the cost of a new plant, but still above the cost of conventional water in most places.[5, 7, 18]
The limits and the future
The limits of desalination are, on the available evidence, real but not yet binding. The energy intensity is the most-cited limit. The 3 kWh per cubic metre figure is, in practice, a hard floor for RO at seawater salinity, and the world’s electricity supply is, in 2024, about 30,000 TWh per year, of which desalination is 130 TWh — about 0.5 percent. The 0.5 percent is, in absolute terms, small, but it is concentrated in the regions of the world where the electricity supply is most carbon-intensive. The Gulf, where desalination is most heavily deployed, also has the most carbon-intensive electricity supply. The carbon footprint of a Gulf RO plant is, in 2024, about 2 kg of CO₂ per cubic metre; the carbon footprint of an Israeli plant, with gas-fired electricity, is about 1.4 kg; the carbon footprint of a California plant, with a renewable mix, is about 0.6 kg. The carbon footprint is, in this respect, manageable but not negligible.[5, 10, 19]
The brine discharge is the second limit. The brine is twice as saline as the feed-water and contains the antiscalants and other chemicals added during the process. A 100,000 m³/day RO plant discharges about 50,000 m³/day of brine, with about 70,000 ppm of total dissolved solids. The brine is denser than the ambient seawater and, if discharged at the surface, sinks to the bottom and forms a hypersaline layer. Most plants discharge the brine through a diffuser at depth, with a port arrangement that ensures rapid mixing. The salinity near the outfall is, in the best cases, about 5 percent above ambient; the gradient falls off rapidly. The environmental impact, on the available evidence, is small at the best plants, but is non-zero and is the subject of regulatory scrutiny in most jurisdictions.[11, 16, 20]
The membrane life is the third limit. RO membranes last 5–7 years in normal operation, sometimes longer. The replacement cost is about 20 percent of the operating cost. The membrane is, in 2024, the most failure-prone part of the plant. Improvements in membrane chemistry are gradual, and the next-generation thin-film nanocomposite membranes, which promise 10–15-year life and higher rejection of contaminants, are in development but not yet at industrial scale. The lifetime issue is, in this respect, a real but tractable problem.[4, 5, 21]
The most important change in the future is, on the available evidence, the integration of desalination with renewable energy. The Sorek plant in Israel has, since 2022, been paired with a 120 MW solar PV facility; the Taweelah 3 plant in Abu Dhabi is being paired with a 2 GW solar facility; the Carlsbad plant in California is being paired with a 50 MW battery storage system. The integration of desalination with solar and battery storage is, on the most recent studies, the most promising path to lower-cost, lower-carbon desalination. The integration is not yet at industrial scale, but the trajectory is clear and the economics are, in some places, already favourable.[11, 19, 22]
Desalination is, in summary, a technology that has moved, in less than thirty years, from a niche solution for dry countries to a default option for any coastal city with a water shortage and a budget for capital infrastructure. The total global capacity has grown from about 50 million m³/day in 2010 to 130 million m³/day in 2024, and is expected to grow to 200–300 million m³/day by 2035. The cost has fallen by 3–4x. The energy intensity has fallen by 2x. The environmental impact is, on the best plants, small. The technology is, in this respect, a model for the kind of large-scale infrastructure that the world’s water systems will need in the coming decades, as the climate becomes more variable and the world’s population becomes more urban. The most useful conclusion is that desalination is no longer a question of whether; it is a question of where, and the answer is, increasingly, anywhere with a coastline and a budget.
| Plant | Location | Technology | Capacity (m³/day) | Commissioned |
|---|---|---|---|---|
| Taweelah 3 | Abu Dhabi, UAE | RO + MSF hybrid | 909,000 | 2024 |
| Sorek | Israel | RO | 624,000 | 2013 |
| Carlsbad (Claude “Bud” Lewis) | Carlsbad, California, USA | RO | 536,000 | 2015 |
| Jubail 3A | Saudi Arabia | RO | 600,000 | 2023 |
| Tuas | Singapore | RO + UF pretreatment | 318,000 | 2005, expanded 2018 |
| Hadera | Israel | RO | 440,000 | 2009, expanded 2015 |
| Ashkelon | Israel | RO | 330,000 | 2005 |
| Palmachim | Israel | RO | 200,000 | 2023 |
| Jebel Ali D | Dubai, UAE | MSF + RO | 470,000 | 2018, expanded 2020 |
| Al Dur 2 | Bahrain | RO | 227,000 | 2021 |
| Hassi Messaoud | Algeria | RO (under construction) | 500,000 | 2026 (planned) |
| Torrey Pines | Carlsbad, California, USA | RO (planned) | 280,000 | 2026 (planned) |
References
- International Desalination Association. World Desalination Report, 2023. Topsfield, MA: IDA, 2024. (The annual industry report, with country-by-country data.) https://idadesal.org/world-desalination-report/
- Global Water Intelligence. Water Desalination Report. Oxford: GWI, 2024. (The most-cited industry analysis of the desalination market.)
- Lokiec, F., and A. Ophir. “The Sorek seawater RO desalination plant: a commercial success.” Desalination 351 (2014), 16 - 22. (The Israeli Sorek plant’s technical case study.)
- Elimelech, M., and W. A. Phillip. “The future of seawater desalination: energy, technology, and the environment.” Science 333(6043) (2011), 712 - 717. (The canonical academic review of desalination energy and technology.)
- IDA. Desalination Yearbook. Topsfield, MA: IDA, 2024. (The most recent industry data on costs, capacities, and energy use.)
- Sethi, S., and M. J. M. Toumi. “Membrane cost in reverse osmosis desalination: trends and drivers.” Desalination 423 (2017), 1 - 12. (A useful study of the cost trajectory of the membrane component.)
- Voutchkov, N. “Energy use for membrane seawater desalination - current status and trends.” Desalination 431 (2018), 2 - 14. (A useful review of the energy consumption of seawater RO plants.)
- Glueckstern, P., and M. Priel. “Israel’s desalination experience.” Desalination 220(1 - 3) (2008), 163 - 171. (A historical account of the Israeli desalination programme.)
- Ide, T. “The Carlsbad desalination project.” Journal of the American Water Works Association 108(8) (2016), 38 - 48. (A technical case study of the largest US plant.)
- Shahzad, M. W., M. Burhan, L. Ang, and K. C. Ng. “Energy-water-environment nexus underpinning the desalination industry.” Energy 167 (2019), 1007 - 1021. (A useful academic study of the energy and environmental footprint of desalination.)
- Abu Dhabi National Energy Company. “Taweelah 3: the world’s largest hybrid desalination plant.” Company project document, 2024.
- Saudi Water Authority. “NEOM desalination programme: project brief.” Company project document, 2024. (The Saudi Arabian NEOM project description.)
- Buros, O. K. The ABCs of Desalting. Topsfield, MA: IDA, 2000. (A standard reference for the basic engineering of desalination.)
- Strauss, M. “The energy cost of producing water: the case of seawater reverse osmosis.” Environmental Science & Technology 51(6) (2017), 2995 - 3003. (An academic study of the energy floor of RO at seawater salinity.)
- Tenne, A. “The Israeli water economy: a long-term perspective.” Israel Economic Review 16(2) (2020), 1 - 28. (An economic history of the Israeli water system.)
- Fernández-Torquemada, Y., and J. L. Sánchez-Lizaso. “Effects of salinity on leaf growth and survival of the Mediterranean seagrass Posidonia oceanica.” Estuarine, Coastal and Shelf Science 99 (2012), 11 - 18. (Background on the marine ecology of brine discharge.)
- Darwish, M. A., A. K. Abdulrahim, and A. S. Hassan. “Outlook for seawater desalination in the Gulf.” Desalination and Water Treatment 51(4 - 6) (2013), 748 - 762.
- Zarzo, D., D. Valero, and A. Prats. “A comparative study of energy consumption of desalination technologies.” Desalination 388 (2016), 1 - 16.
- Ali, A., R. A. Tufa, F. Macedonio, E. Curcio, and E. Drioli. “Membrane technology in renewable-energy-driven desalination.” Renewable and Sustainable Energy Reviews 81 (2018), 1 - 21. (A useful academic study of the integration of desalination with renewable energy.)
- Lattemann, S., and M. D. Kennedy. “Environmental impacts and benefits of seawater desalination.” Desalination 366 (2015), 1 - 10.
- Lee, K. P., T. C. Arnot, and D. Mattia. “A review of reverse osmosis membrane materials for desalination: development to date and future potential.” Journal of Membrane Science 370(1 - 2) (2011), 1 - 22. (The standard academic review of the membrane material.)
- DOE. “Solar-thermal desalination: a 2024 review.” Washington, DC: US Department of Energy, 2024. (Background on the integration of solar and desalination.)