Cecilia Payne and the Composition of the Stars
In 1925 a graduate student at Harvard calculated the composition of the stars and found them made almost entirely of hydrogen, with helium second and everything else a trace. The numbers were right, and she knew they were right, and she published them under a sentence saying that the enormous abundances they implied were almost certainly not real. Four years later Henry Norris Russell reached the same conclusion by another route and called her thesis the most important previous determination of the abundance of the elements by astrophysical means. This is the story of how a cautious scientist kept a right answer on the record, and of what it cost[1, 2].
Key findings
- Payne’s Table XXVIII, “logarithm of the relative abundance”, put hydrogen at 11 and helium at 8.3 on her own scale, against magnesium at 5.6. The metals were a trace[3].
- Russell’s 1929 Table XVI, “Comparison with Miss Payne’s Results”, converts the same two numbers to 12.9 and 10.2 on his scale — a stated shift of +1.9[1].
- The Balmer lines understate the hydrogen badly: only about one hydrogen atom in two hundred million is in the excited state in a 5700 K solar atmosphere, so the absorption lines represent a minute fraction of the total[3].
- Russell advised her in January 1925 to be cautious about the limits of the thermodynamic method with Saha’s then-new theory, and approved the thesis in full in April 1925, Table XXVIII included[4, 5].
- Russell, in 1929, at page 64: “The most important previous determination of the abundance of the elements by astrophysical means is that by Miss Payne”[1, 4].
The Machine That Counted Stars
Cecilia Helena Payne was born on 10 May 1900 at Wendover in Buckinghamshire. She went up to Newnham College, Cambridge, in 1919 to read botany, and switched to physics after hearing Arthur Eddington lecture on the results of the 1919 solar eclipse. She took the Mathematical Tripos in 1922 and was refused a degree, because Cambridge did not then confer them on women. That single institutional fact sets the terms of everything that followed. She left England for the United States in 1923 with a fellowship to Radcliffe College, and the women of that period travelled for exactly this reason: to be left alone by the institutions that would not have them[5, 6].
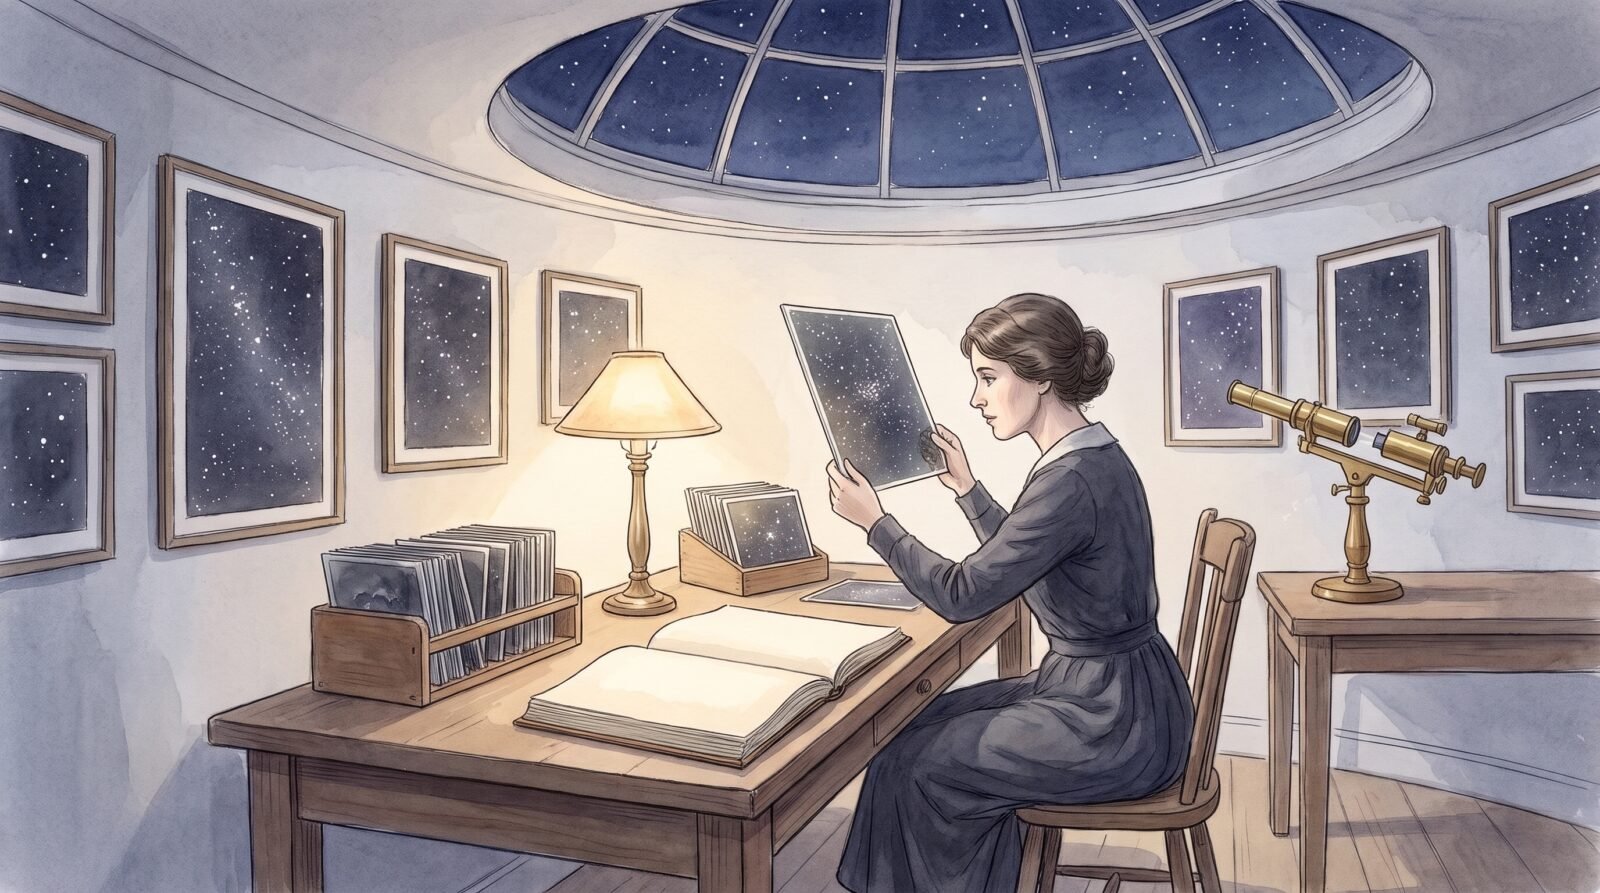
She arrived at Harvard and found the place that would make her career and the place that would hold her back, in the same institution. The Harvard College Observatory was, by the middle of the 1920s, the centre of stellar astronomy in the world, and the reason was a photographic archive. Glass plate negatives by the hundred thousand had been accumulating for decades, each one a small window of sky recorded on a single sheet of glass, and the work of the observatory was to sort them. The sorting was done largely by women, hired as computers, who classified the stars on the plates by their spectra and measured their positions. By 1920 the women computers of Harvard had catalogued some 400,000 stars by spectral type. The collection survives as the Harvard Plate Stacks: nearly 600,000 glass plate negatives, of which some 428,000 have been digitised[7, 5].
Payne arrived at the Radcliffe fellowship with what she described as utter bewilderment, and took some years to find a problem. Her supervisor was Harlow Shapley, who was by then the most famous astronomer in America and a man of extraordinary decency. The difficulty was not the supervisor. It was that a thesis needed to be printed, a thesis needed a defence, a thesis needed an examiner willing to sign it, and a woman graduate student in the Harvard of the early 1920s had to navigate all of that before she could say anything. What she eventually did was to take the most fashionable piece of new physics in the subject and turn it round[5, 8].
The physics was Meghnad Saha’s ionisation equation, published in 1920. The Saha equation relates, for a given gas at a given pressure and temperature, the proportion of atoms that are ionised to the proportion that are not. It is the statistical mechanics of a single equilibrium, and it had been derived within the last five years. Before Saha, nobody had a quantitative handle on how much of any element in a gas is in the form of ions at a given temperature. After Saha, it was a routine calculation — provided you could get the ionisation potentials, the energies needed to strip an electron off each kind of atom, which is where the real difficulty lay[3, 9].
It is worth being clear about what was known before Payne, because the framing of her problem is often misdescribed. It was not the case that nobody had any idea what the stars were made of. The solar spectrum had been decomposed for decades and the presence of hydrogen in the Sun was not in doubt. What was missing was a per-element scale: a way of saying not that iron is present in the Sun, but that iron is present in it in this amount relative to that of magnesium, and that both are negligible beside hydrogen. The Sun had been measured. The stars had not. Payne’s thesis supplied the scale, and it applied to a population of stars rather than to one.
Payne’s move was to run Saha’s equation backwards. Instead of asking, given a temperature and a pressure, what fraction of an element would be ionised, she asked: given the spectral lines I can actually see in the atmosphere of a star, and given its temperature, what are the relative abundances of the elements and ions up there? The strength of an absorption line depends on the number of atoms in the state that can absorb that particular line. So the intensity of a line in a stellar spectrum is a way of counting atoms, provided you know what fraction of them are in the right state, and Saha’s equation was the tool that converted a line intensity into an abundance. The footing was supplied by Fowler and Milne, whose 1924 statistical-mechanical re-derivation had made the equation usable for stellar work[3, 10].
The work was done in Cambridge, on the data of the Harvard plates, and it was reviewed in Nature in October 1925 by E. A. Milne, who had supervised it. The review was signed with the initials E. A. M. That review is the first public notice of the result, and the thesis itself, Stellar Atmospheres, was published as a Harvard College Observatory monograph later the same year. A companion paper, “Astrophysical Data Bearing on the Relative Abundance of the Elements”, appeared in the Proceedings of the National Academy of Sciences in 1925 and carries the substance of the argument in seven pages. Two documents, one body of work, and a piece of data in both of them that would become the most famous table in the history of American astronomy[2, 3, 10].
The Numbers in Table XXVIII
The table is called Table XXVIII and its heading is “logarithm of the relative abundance”, on Payne’s own scale. hydrogen at 11. Helium is set at 8.3. Then come the metals, in descending order: magnesium at 5.6, ionised magnesium at 5.5, sodium at 5.2, aluminium at 5.0, ionised calcium at 5.0, ionised silicon at 4.9, silicon at 4.8, calcium at 4.8, iron at 4.8, ionised carbon at 4.5, manganese at 4.6, titanium at 4.1, zinc at 4.2, chromium at 3.9, potassium at 3.5, vanadium at 3.0, strontium at 1.8, ionised strontium at 1.5, ionised barium at 1.1 and lithium at 0.0. The ionised helium column is left blank. Read the list down and the shape of the result is unmistakable: hydrogen, then helium, and then a long thin tail of everything else that chemistry had names for[3]
It is a logarithmic scale, which means that a difference of one unit is a factor of ten, and that is where the scale of the finding comes from. A gap of 11 down to 5.6 is five and a half orders of magnitude, so hydrogen was about a million times more abundant than magnesium in the solar atmosphere. Payne herself summarised the result in her later writing in exactly that form: hydrogen was a million times more abundant than the metals. The Smithsonian’s account of the discovery puts it the same way, that hydrogen was a million times more abundant than metals like aluminium and silicon. It is worth being precise about the scale, because a commonly repeated figure — that helium was about ten thousand times the solar abundance of the metals — is not what the table says. The table says helium at 8.3 against hydrogen at 11, which is about five hundred times less abundant than hydrogen, and against magnesium at 5.6, which is about six hundred times more abundant[3, 6, 11]
The table is also where the argument nearly stopped. In the text that accompanies it, Payne explained that the Balmer lines of hydrogen behave as the lines of an ionised atom, and that they are formed by atoms which have been excited from the ground state into one of the higher levels from which they can absorb. In the solar atmosphere at about 5700 K, only a tiny fraction of the hydrogen atoms are in those excited states at any moment — on the order of one atom in two hundred million. A line that only a two-hundred-millionth of the atoms can produce is therefore an extraordinarily poor measure of how much hydrogen there is, and it understates the total by an enormous factor. The same argument applies to helium, whose lines have their own critical potentials[3].
The difficulty was not only with hydrogen. Metals are hard to weigh for the opposite reason: they are scarce, they have many lines, and most of those lines are weak and blended with their neighbours, so that a metal abundance has to be extracted from a set of lines whose strengths depend on excitation as well as on abundance. Every metal also has its own ionisation potential and its own critical potential, and the higher it is, the more of the element sits in the neutral state at stellar temperatures. It was that tabulated data, more than anything else, that stood between a student in Cambridge and a usable answer.
And then comes the sentence. The enormous abundance derived for these elements in the stellar atmosphere is almost certainly not real. The companion phrase in the same passage is that the abundances are impossibly high. This is the hinge of the whole story, and it is not a case of a result being quietly buried, because the table is right there in the thesis with its numbers, and the numbers are the correct ones. What Payne did was accept the correctness of the table and reject the interpretation she had to place on it, because the method that produced the table was five years old and the physical reason she had for doubting it — the Balmer line problem — was a known weakness of the method that she had set out explicitly and then set aside[3, 4].
The pattern is worth naming, because it is not unusual and because it is not the same thing as a failure. The cautious scientist is not the one who hides a result. It is the one who publishes a result, states plainly what it says, and then writes down exactly how much they do not trust it and why. Anyone reading Table XXVIII with any competence would have seen that hydrogen dominates. The sentence about its not being real told them that the author thought the method could not be trusted — which was true — and the numbers were left in place where they could be checked. By the time the method was fixed, the table had been in print for three years and nobody could say that the result had been hidden[3, 5].
One piece of the puzzle was the critical potentials that the Saha calculation needed. The standard source for them at the time was the work of Hertha Sponer, whose determinations of ionisation potentials and of electron paths in the inert gases were tabulated in the thesis on page 17 and cited in a footnote as Sponer, Zeitschrift fur Physik 18, 249, 1923. Sponer was a physicist of the first rank who went on to work at Gottingen, to publish on molecular spectra, and to rediscover the Heitler and London result that underlies the modern theory of the chemical bond; she is remembered as the maven of quantum spectroscopy. The point for Payne’s story is narrower and simpler: the numbers that made the calculation possible were five years old, and the woman who had measured them was one of the few people in the world who could have supplied them[12, 13, 3].
Russell, 1929, and the Paper That Took the Credit
Henry Norris Russell was Payne’s external examiner and a member of her thesis committee. He was also, at the time, the leading authority in the United States on the composition of stellar atmospheres, and he had already done the classical work: his own analysis of ionised calcium, the Ca II lines, had settled the temperature scale of stellar classification and given the spectral line intensities a meaning that the whole field used. When Payne’s results reached him, his reaction, in the words used afterwards, was that they were clearly impossible. The phrase that has stuck is that she had shown hydrogen to be a million times more abundant than the metals, and Russell replied clearly impossible. The scale of the numbers was not the problem. The problem was that the method could not, in his judgement, be stretched that far[6, 4].
For a long time this was told as a story of a famous man taking a young woman’s discovery and presenting it as his own. The 2010 reassessment by Owen Gingerich, and the reading of the documentary record that follows from it, complicate that story considerably, and the complexity is the interesting part. In January 1925 Russell advised Payne to be cautious about her conclusions. The caution was not an instruction to withdraw them. It was a warning about the limits of the thermodynamic method, applied to a Saha theory that was barely five years old and had never before been run backwards across a stellar atmosphere. And in April 1925 Russell approved the thesis in its entirety, Table XXVIII included. He read the table, and he signed for it, and the table said what it said[4, 5, 11].
What then happened, in 1929, was not theft but something more awkward. Russell published, in the Astrophysical Journal, a paper entitled “On the Composition of the Sun’s Atmosphere”, running to some seventy pages, which reached by an independent route the conclusion that the Sun is mostly hydrogen. That same paper is the one that carries the Hertzsprung-Russell diagram, as a figure; the diagram is not described in the searchable text of the paper, and it is often misdated to 1925, when Russell had published on the spectrum of ionised calcium instead. It is the 1929 paper, and the diagram within it, that fixed the diagram in the language of astronomy[1, 9]
The paper also contains, on page 64, a sentence that is worth reading closely because of what it concedes. The most important previous determination of the abundance of the elements by astrophysical means is that by Miss Payne. That is the claim of a man who has just reached, by his own route, a conclusion that somebody else had published four years earlier, and who has chosen to name her. The paper carries a Table XVI headed “Comparison with Miss Payne’s Results”, in which her hydrogen figure of 11 and her helium figure of 8.3 are converted to 12.9 and 10.2 on his scale. The conversion is a stated shift of +1.9 in the logarithm, and it is applied to both numbers alike. Two documents, produced four years apart by different people using different routes, agree on the same two figures, and the second of them says so in print[1, 4].
The gap between the two papers is instructive as well. Russell’s conclusion was built on the Ca II doublet, the pair of calcium lines known as K and H, whose relative intensities shift with temperature and with pressure in a way that can be calibrated in the laboratory and then read off a stellar spectrum. That is a different and more robust instrument than the Saha inversion Payne had used, because the Ca II lines are strong and abundant in the stars whose temperature makes them measurable. In the same years Otto Struve was pursuing the calcium line method independently in a series of papers, and in 1926 he published a long review of Payne’s thesis that took the argument seriously on its own terms rather than dismissing it. The impression left by that review, and by Struve’s subsequent work, is not of a field that ignored the thesis. It is of a field that found the thesis’s conclusion right, its method shaky, and its table indispensable[9, 14].
It is worth seeing how much the two routes shared, because the resemblance is the reason the history is not a story of two people disagreeing. Both approaches needed the same missing physics: the number of atoms sitting in an excited state and ready to absorb a particular line. Saha supplied the machinery for working that out in a stellar atmosphere, and the Ca II method needed it just as much, because the strength of the calcium lines is governed by the same populations. The difference was that Russell’s route was anchored on two lines whose laboratory behaviour had been measured to high accuracy, whereas Payne’s was anchored on a set of weak metal lines whose laboratory behaviour was known less well. That was a difference of degree, and it closed.
There is a further thread in the record that is usually left out. The International Astronomical Union held its third General Assembly at Leiden between 5 and 13 July 1928, and the proceedings, published by Cambridge University Press in 1929, carry a discussion in which the composition of the stars and the interpretation of Payne’s abundances were debated in the open. Payne had herself travelled in Europe in 1923 and 1924, visiting the observatories at Leiden, Copenhagen and Stockholm, and she was present at the beginning of that conversation rather than being told about it afterwards. The episode that is usually remembered — a discovery credited to the wrong person — happened inside a community that knew perfectly well what her thesis said, because her thesis had been in print since 1925 and had been reviewed in the leading journal of the field[15, 8, 10].
The reading of the episode has moved over time. For several decades the standard account was a story of suppression: a thesis approved but disbelieved, a conclusion announced by a man four years later, and a footnote at best. The documentary work of the last fifteen years has made that account harder to sustain, and replaced it with something more interesting, in which the caution was sound, the method was weak, and the credit was ultimately given.
The retrospective verdict is worth quoting, with its date attached, because the date is the point. Otto Struve, by then in his fifties and long since the doyen of American astronomy, described the thesis in 1962 as the most brilliant PhD thesis ever written in astronomy. That assessment belongs to a retrospective, published in the 1960s, and not to any judgement made in 1925. It is worth setting beside Russell’s own sentence of 1929, because the two together describe the outcome rather than a theft: a result that was published, doubted, methodologically vindicated, and then credited to the person who had got there first[11, 16].
The Rest of Her Life: Variable Stars and the Galaxy
What Payne did next was leave stellar atmospheres behind and found a field. The subject was variable stars: stars whose brightness varies, on a cycle, for reasons that are usually internal. The problem was that the Harvard plate collection was full of them. Hundreds of thousands of plates, each with a known date, gave a light curve for every star on them whether or not anyone had looked, and the curves were sitting unused in drawers. Payne-Gaposchkin and her husband Sergei Gaposchkin began to mine them, and their 1942 paper “On the Dimensions and Constitution of Variable Stars” set out what could be deduced about the physical nature of these objects from their periods, their light curves and their spectra[17, 5].
It was a field she effectively created, and she created it with the same method that had marked her thesis, in the stellar atmospheres of stars: take a large body of photographic data, treat it quantitatively, and refuse to be impressed by received opinion about what the numbers could possibly mean. The Cepheid variables became the yardstick of the Milky Way, because a Cepheid’s period gives its absolute brightness and therefore its distance, and a galaxy full of Cepheids can be measured from the outside. From the 1940s into the 1950s the Gaposchkins read the structure of our own galaxy off the variable stars in it, and the celebrated visual map of the Milky Way that bears Sergei Gaposchkin’s name in 1959 came out of that work. Her own book, Variable Stars and Galactic Structure, appeared in 1954[18, 5].
The institutional record is a separate and rather different story. She married Sergei Gaposchkin in 1934 and chose to hyphenate her name rather than replace it, a decision that has been read as an early and very deliberate act of self-preservation in a profession that changed its name by marriage as a matter of course. She became the first woman to hold a full professorship at Harvard, in 1956, and later headed a department there. The work continued at the end of the Plate Stacks, where the notebooks of the women computers — more than two and a half thousand of them — are now being digitised, along with her own logbooks, which carry her name on the flyleaf. The American Physical Society summarised the arc in 2015 in a single line: the Universe changed[19, 5].
Everything in the second half of her career rested on the archive. The plate stacks were not a record of what had already been found; they were a record of everything that could still be found. A light curve assembled from a hundred plates spread over forty years is not a curiosity but an instrument, and the Gaposchkins built a discipline on that principle. The same plates that made the hydrogen table possible were still sitting in drawers in 1930, and the notebooks of the women who had classified them were still unread.
It is worth correcting one bibliographic point while we are here, because it has confused accounts for years. The ten-volume series Stars and Stellar Systems is a Chicago series, and its fifth volume is Galactic Structure, published in 1957. The volume called Stellar Structure is the eighth, from 1965. Payne-Gaposchkin’s own book of 1954 was Variable Stars and Galactic Structure, which is her own and not a volume of the series at all. The confusion has the odd effect of making her look as though she had written a chapter of the standard reference work, which she had not[18, 5].
The long view of her career is a good corrective to the way the episode is usually compressed into a single anecdote about credit. The hydrogen result was one paper of 1925. The rest was half a century of building fields: variable stars, the structure of the galaxy, the photometry of the plate archive, and the training of a generation of students who did not know that the woman whose name was on the observatory’s star lists had once rewritten the composition of the universe. The biography published by Harvard University Press in 2020 is the fullest modern account. The autobiography she wrote herself, The Dyer’s Hand, published in 1979, is the one in which she tells it her own way, and the title comes from the craft of the dyer, whose hands are stained by the work[8, 5].
A Common Chemistry and a Common Physics
It is a shame that the most quoted line associated with Payne’s work is one she did not write. The image of the Sun as a laboratory boiler room has circulated for decades as though it were hers. It appears nowhere in the thesis, nowhere in the 1925 Nature review, and nowhere in the biographical material consulted for this account, and it is very likely a misattribution. The verified substitutes are better anyway, and one of them is hers[5, 8].
The first is from a radio talk she gave in November 1925, published as The Universe of Stars in 1926. She describes picking out, in the spectrum of the Sun, the colours given out by an atom of iron, and then noting that they are exactly the colours that a piece of iron heated in the electric arc in the laboratory would give out; and then she draws the conclusion: a common chemistry and a common physics run through the universe. The wording should be checked against the printed text before being quoted word for word, but the argument is hers and the sentiment is secure. It is the argument of the whole discovery, stated in public, in the year the table was published: the laboratory and the Sun are made of the same stuff and obey the same laws, and the only question is whether we are clever enough to read one off the other[3, 10].
The second is from the thesis itself, and it is the sentence that carries the generalisation the table only hints at: the solar atmosphere is probably qualitatively representative of all normal stellar atmospheres. That is the claim which makes the table an account of the stars and not merely of the Sun, and it is the claim that later work confirmed in detail. Once the method was repaired — and it was repaired by others, and then by her — the hydrogen-helium picture became the standard account of ordinary stellar atmospheres, and the exceptions turned out to be the interesting cases: the hot young stars of spectral type O and B, where the hydrogen lines dominate because almost all the hydrogen is ionised, and the red giants, where the surface is not a fair sample of the interior at all[3, 11].
Put the documents in order and the question of suppression becomes very difficult to sustain. The thesis was approved in April 1925. The Nature review by Milne appeared that October. The monograph and the PNAS paper came out the same year. Struve reviewed the thesis in the Astrophysical Journal in 1926, and Merrill reviewed it in the Publications of the Astronomical Society of the Pacific. The composition of the stars was discussed openly at the Leiden General Assembly of the IAU in July 1928. And then in 1929 Russell published a paper in which the previous determination was named. There is no year in that sequence in which the result was not in public print.
So the shape of the whole episode is worth stating plainly, because it is not the shape the moral usually takes. A young woman took a new equation, five years old, and ran it in a direction nobody had run it, against the best data in the world, and got an answer that was right by a factor of a million and that everybody who examined it thought was impossible. She was advised to be careful by the man who had done the classical work and who would, four years later, reach her conclusion and credit her for it in print. She published the table with the numbers and published her doubt about them in the same document, and the doubt was correct: the method, not the numbers, was what was wrong. And when the method was fixed, the table stood, and the woman who had written it down had already gone on to do something else — to look at a different set of stars, and to find the structure of our own galaxy in them[2, 1, 3].
What she did not do was fight for credit, and the reason is not a failure of ambition but the nature of the case. She was right and she knew it, and the person best placed to confirm it was the man she had already argued with. The table was in print. The thesis was in print and had been reviewed in Nature and in the Astrophysical Journal and in the Publications of the Astronomical Society of the Pacific. A community that is willing to publish a table, print a caution about it, and then print a sentence four years later calling that table the most important previous determination of the abundance of the elements by astrophysical means is not a community that has lost a discovery. It is a community that has been slow, which is a different and more ordinary failure, and which the sentence on page 64 of the 1929 paper was designed to repair. Payne-Gaposchkin lived until 1979. The star she had read the universe out of had, by then, a proper name and a proper place in it, and her own was on the list of fixed stars[1, 19, 6].
References
- Russell, H. N. (1929). “On the Composition of the Sun’s Atmosphere”. Astrophysical Journal 70, 11 - 82. adsabs.harvard.edu
- Payne, C. H. (1925). “Astrophysical Data Bearing on the Relative Abundance of the Elements”. PNAS 11, 192 - 198. pmc.ncbi.nlm.nih.gov
- Payne, C. H. (1925). Stellar Atmospheres. Harvard College Observatory. gutenberg.org
- Gingerich, O. (2010). “Cecilia Payne, H. N. Russell and Early Stellar Spectroscopy”. J. Hist. Astronomy 13, 139. adsabs.harvard.edu
- Science History Institute, “Cecilia Payne-Gaposchkin”. sciencehistory.org, accessed 2 November 2026
- MacTutor History of Mathematics Archive, “Cecilia Payne-Gaposchkin”. mathshistory.st-andrews.ac.uk, accessed 2 November 2026
- Linda Hall Library, “Cecilia Payne-Gaposchkin”. lindahall.org, accessed 2 November 2026
- Moore, D. (2020). What Stars Are Made Of. Harvard University Press. hup.harvard.edu
- Struve, O. (1926). “Stellar Atmospheres” (review of Payne’s thesis). Astrophysical Journal 64, 204. adsabs.harvard.edu
- Milne, E. A. (1925). “Stellar Atmospheres” (review). Nature 116, 530 - 532. nature.com
- Smithsonian Magazine, “A Century Ago, Pioneering Astrophysicist Cecilia Payne-Gaposchkin Showed Us What Stars Are Made Of”. smithsonianmag.com, accessed 2 November 2026
- American Institute of Physics, “The Life and Legacy of Hertha Sponer”. aip.org, accessed 2 November 2026
- Golden, K. M. “Hertha Sponer: Maven of Quantum Spectroscopy”. Cambridge University Press. cambridge.org
- Merrill, P. W. (1926). “Stellar Atmospheres (Cecilia H. Payne)”. PASP 38, 33. doi.org
- Stratton, F. J. M. (ed.) (1929). Transactions of the International Astronomical Union, vol. 3, Leiden, 5 - 13 July 1928. Cambridge University Press. books.google.com
- University of Cambridge, “Cecilia Payne-Gaposchkin”. cam.ac.uk, accessed 2 November 2026
- Payne-Gaposchkin, C. P. and Gaposchkin, S. (1942). “On the Dimensions and Constitution of Variable Stars”. PNAS 28, 490 - 495. pmc.ncbi.nlm.nih.gov
- Payne-Gaposchkin, C. (1952). “Variable Stars and Galactic Structure”. Nature 170, 223. nature.com
- American Physical Society (2015). “Cecilia Payne-Gaposchkin: the Universe changed”. APS News. aps.org